An OEE score of 70% tells you how you performed. But a machine timeline tells you why. Without a chronological view of machine states, you are managing by looking at a rearview mirror.
The Anatomy of a Machine Day
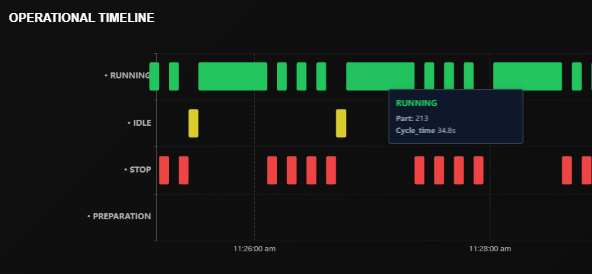
When we look at a WhereFy timeline, we categorize every second into four distinct buckets. Understanding the micro-interactions between these states is where the real profit is found.
Running (Value Add)
The machine is actively cutting or moving. This is the only state that makes you money. The goal is to maximize the length of these green blocks.
Stopped (Unplanned Downtime)
Alarms, breakdowns, or emergency stops. The timeline shows exactly when it happened, allowing maintenance to correlate failures with specific shifts or jobs.
Idle (The Silent Killer)
The machine is ON, there are NO alarms, but it is NOT cutting. This usually indicates operator absence, waiting for material, or waiting for inspection.
Preparation (Setup/Changeover)
Essential but non-productive time. By visualizing setup duration on a timeline, you can see if a 30-minute setup is consistently dragging into 90 minutes.
Why Timeline Over Totals?
Imagine two machines. Both have 4 hours of downtime.Machine A has one 4-hour breakdown.Machine B has forty 6-minute stoppages throughout the day.
Total OEE treats them the same. The Timeline shows you that Machine A has a maintenance issue, while Machine B has a process or operator training issue.
| Scenario | OEE Score | Timeline Insight |
|---|---|---|
| One 4-hour breakdown | 70% | 🔴 Maintenance issue |
| Forty 6-min stoppages | 70% | 🟠 Process/operator issue |
Pro Tip
Use the timeline to spot "First Piece Inspection" bottlenecks. If you see a long blue "Preparation" block followed by a long orange "Idle" block, your operators are likely waiting for the quality lab to clear their first part.
What the Timeline Reveals That OEE Hides
Pattern Recognition
See recurring idle blocks at the same time each shift — revealing lunch breaks, shift changes, or material shortages.
Shift Comparison
Compare timelines across shifts to identify which team has the fastest setups and why.
Downtime Root Causes
Categorize each red block with a reason — mechanical failure, tool change, material issue — and track trends.
Speed Loss Detection
See when machines run slower than rated speed — often invisible without second-by-second data.
Take Action
The timeline doesn't just monitor machines; it monitors the flow of your entire factory. By analyzing the sequence of events, you can move from reactive firefighting to proactive optimization.
lightbulbWhereFy Insight
Manufacturers who start analyzing their machine timelines typically find 10-15% hidden capacity within the first month — not from buying new machines, but from seeing and eliminating the invisible gaps between production blocks.
Ready to See Your Machine Timeline?
Stop managing by percentages. Start managing by timelines. Get live visibility into every second of your production day.